Compare car depreciation
This one or that one?
Put two to four cars on one pair of axes and see which of them the Irish market takes value off fastest. Every figure is the median DoneDeal asking price of that model year, with the number of listings it came from beside it — the same numbers each car's own depreciation page shows, so nothing here disagrees with anything there.
What a year of age costs each of them
The yearly rate is a least-squares fit of the median against age across the model years with three or more listings, so it is only as wide as the years it was fitted over — which is why those years are printed beside it rather than left implied.
| Car | Listings | Lost per year | Fit quality R² | Fitted over | Newest year | 5 years old | Value kept at 5 |
|---|
What each model year has actually lost
Not what the curve above implies from cars of different ages today: what sellers were asking for that exact model year in each year it appears in archived DoneDeal listings, ending with the live listings now. A cell needs three listings in a year to appear at all, and two years to show a change.
| Model year |
|---|
Now check the one you are actually looking at
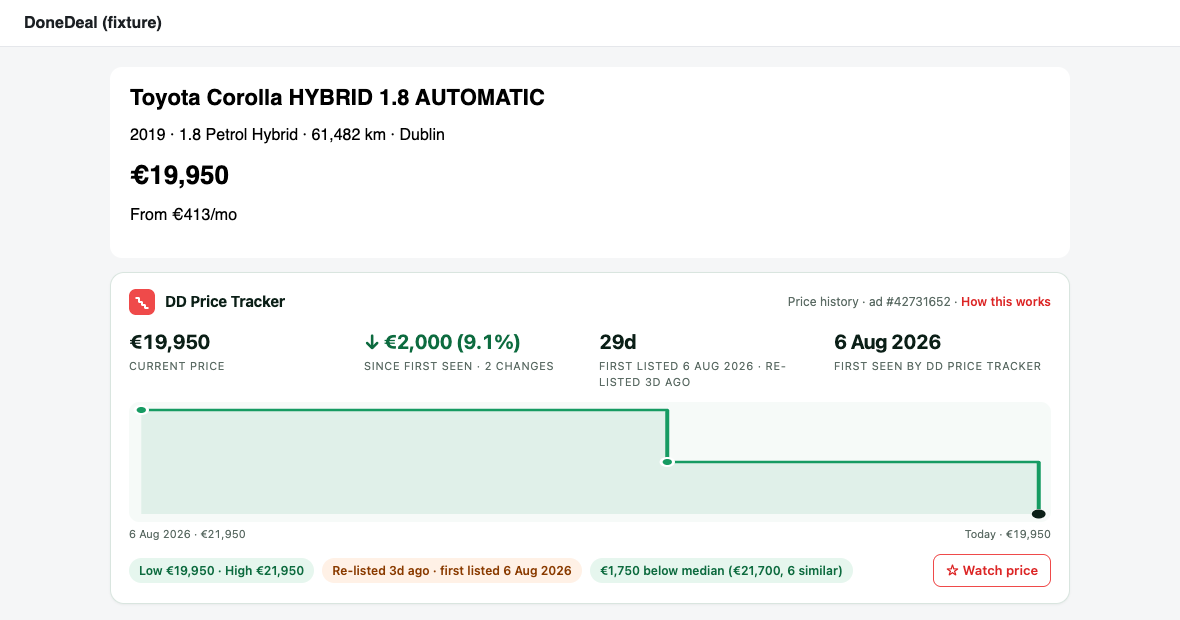
You now know what these cars cost. DD Price Tracker puts the price history, the date the ad really first appeared and the median of similar cars under the price on every DoneDeal ad you open. You will know what the seller knows before you ring.
Free, no account, and nothing about you is stored. On an Android phone it runs in Firefox: the Android guide.
Where these figures come from
DD Price Tracker records the asking prices of public listings on DoneDeal.ie as people using the extension open them, and holds archived copies of listing pages from the Internet Archive for earlier years. For each car you pick, this page groups those listings by model year and shows the median asking price and the number of listings behind it. Nothing is averaged across the cars you are comparing: each one is computed on its own, by the same code that answers its own model page.
These are asking prices, not sale prices, and a median is not a valuation of any particular car. Model years with fewer than three listings are shown in the chart as hollow points and are left out of the fitted rate. A car with fewer than 20 listings across live and archived ads cannot be compared at all, because a line drawn through a handful of ads beside a line drawn through hundreds reads as a finding rather than as noise.
“Value kept” is each car’s own median for a model year as a percentage of its own newest well-populated model year — so it compares how fast two cars fall rather than what they cost, which is the only way a €15,000 car and a €60,000 one can be read on one axis.
What the Irish used-car market did last month
One short email a month: which models moved, where the falls are steepest, and what a year of age is costing. Nothing else, no forwarding, and one click unsubscribes and deletes your address. How we handle it.